Demographic Data
The BMP is committed to providing students with an environment that values holistic diversity. This value is evident through the cohorts we accept each year.
BMP Race and Ethnicity
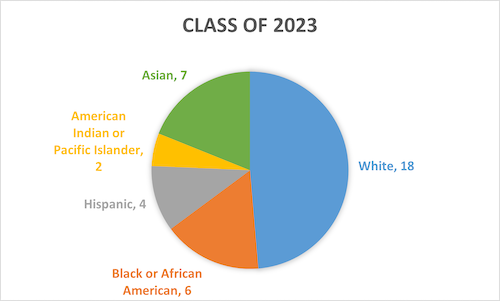
Class of 2023
| Race and Ethnicity | Number of Students | Percentage |
|---|---|---|
| Asian | 7 | 19% |
| American Indian or Pacific Islander | 2 | 5% |
| Hispanic | 4 | 11% |
| Black or African-American | 6 | 16% |
| White | 18 | 49% |
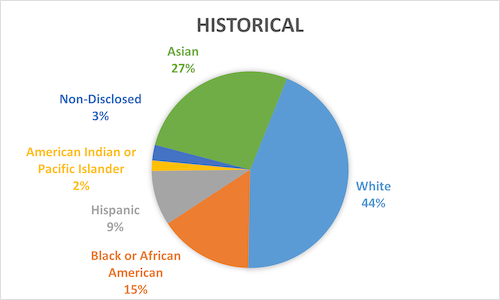
Historical
| Race and Ethnicity | Percentage |
|---|---|
| Asian | 27% |
| American Indian or Pacific Islander | 2% |
| Hispanic | 9% |
| Black or African-American | 15% |
| White | 44% |
Gender Identity
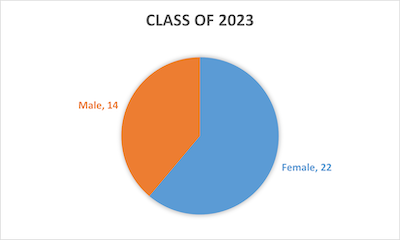
Class of 2023
| Gender | Number of Students | Percentage |
|---|---|---|
| Male | 14 | 39% |
| Female | 22 | 61% |
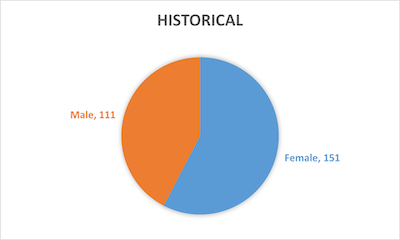
Historical
| Gender | Number of Students | Percentage |
|---|---|---|
| Male | 111 | 42% |
| Female | 151 | 58% |
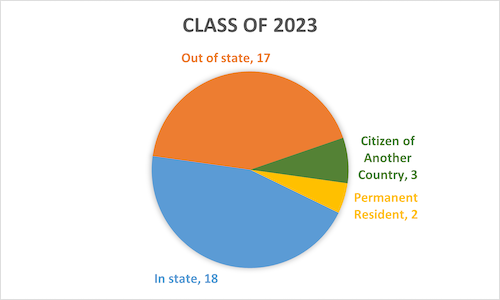
Class of 2023
| Residency/Citizenship | Number of Students | Percentage |
|---|---|---|
| Out of State | 17 | 42% |
| Instate | 18 | 45% |
| Citizen of another country | 3 | 8% |
| Permanent Resident | 2 | 5% |
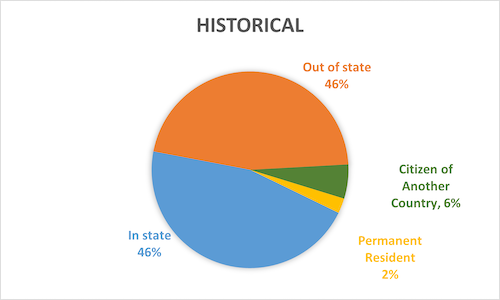
Historical
| Residency/Citizenship | Percentage |
|---|---|
| Out of State | 46% |
| Instate | 46% |
| Citizen of another country | 6% |
| Permanent Resident | 2% |
